

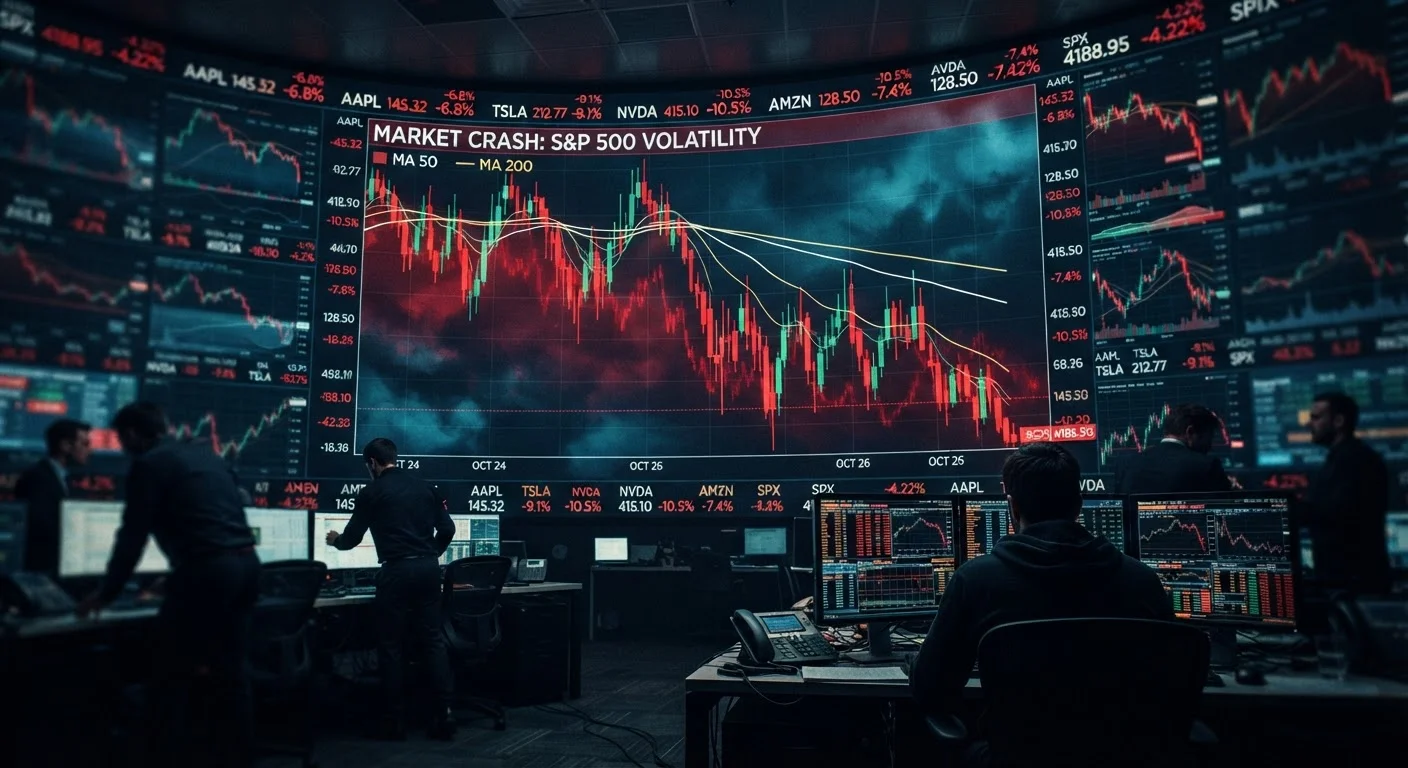
Why Terminology Matters in a Volatile Market
When markets move sharply, financial headlines reach for dramatic language — "crash," "collapse," "meltdown" — often without precision. But these terms carry specific meanings among analysts, and conflating them can lead everyday investors to misread what's actually happening. Before reacting to a headline, it helps to understand the definitions behind the words.
If you're new to how markets function, see our introduction to financial markets for a foundation on how stocks, bonds, and other assets interact.
| VIX "Calm" Threshold | Below 20 (CBOE) |
| Correction Definition | ≥10% decline from recent peak (Standard market convention) |
| Bear Market Definition | ≥20% decline lasting 2+ months (Standard market convention) |
| VIX Full Name | CBOE Volatility Index (Chicago Board Options Exchange) |
| VIX Data Coverage | Expected 30-day S&P 500 volatility (CBOE) |
The VIX: Measuring Fear in Real Time
The CBOE Volatility Index, universally known as the VIX, is a real-time market index that measures expected volatility in the S&P 500 over the next 30 days. Derived from options pricing, it reflects how much uncertainty — or "fear" — traders are pricing into the market at any given moment.
A VIX reading below 20 is generally considered calm. Readings between 20 and 30 signal elevated anxiety. Above 30, conditions are described as highly volatile, and readings above 40 have historically corresponded with severe market stress events. Crucially, the VIX measures expected volatility, not direction — a rising VIX signals uncertainty, which can accompany both sharp declines and sharp recoveries.
VIX
The CBOE Volatility Index, a real-time measure of expected 30-day volatility in the S&P 500 derived from options market pricing. Often called the "fear gauge" by traders and analysts.
Market Correction
A decline of 10% or more in a market index or asset price from a recent peak. Corrections are considered a normal feature of market cycles and do not necessarily indicate a broader economic problem.
Bear Market
A period of sustained price decline of 20% or more from a recent high, typically lasting at least two months. Bear markets can be driven by economic downturns, rising interest rates, or deteriorating investor confidence.
Market Crash
A rapid and severe market decline, often 20% or more, occurring over a very short timeframe — days to weeks. Crashes are typically triggered by sudden shocks, panic selling, or cascading failures in market confidence.
Options Pricing
The market-determined cost of an options contract, influenced by factors including the underlying asset's price, time to expiration, and expected volatility. The VIX is calculated using S&P 500 options prices.
Pullback, Correction, Bear Market, and Crash — Defined
These four terms represent points on a spectrum of market decline, each with broadly accepted thresholds:
- Pullback: A short-term dip of roughly 5% or less from a recent peak. Common even in strong bull markets and generally considered a normal part of price action.
- Correction: A decline of 10% or more from a recent high, typically lasting days to months. Corrections are a normal part of market cycles — the S&P 500 has experienced dozens historically. They do not, by themselves, signal an economic recession.
- Bear Market: A sustained decline of 20% or more from a recent peak, lasting at least two months. Bear markets often — though not always — accompany broader economic contractions. For context on how this phase differs from its counterpart, see our explainer on bull and bear markets.
- Crash: There is no universally agreed numeric definition, but a crash typically refers to a sudden, severe decline of 20% or more occurring within days or a few weeks, often driven by panic selling or a specific triggering event. The speed and severity distinguish a crash from a gradual bear market.
38
Average VIX peak during major market crises
Historical VIX data from the CBOE shows readings during major stress events routinely exceeded 38, with extreme spikes reaching above 80 in 2008 and 2020.
~1 per year
Average frequency of 10%+ corrections in the S&P 500
Historical data suggests corrections of 10% or more have occurred roughly once per year on average over multi-decade periods.
This article is for informational purposes only and does not constitute investment advice. Readers should consult a qualified financial professional before making decisions based on their individual circumstances.
The content on this site is for informational purposes only and is not a substitute for professional advice. Always consult a qualified professional for guidance specific to your situation.