

Option A
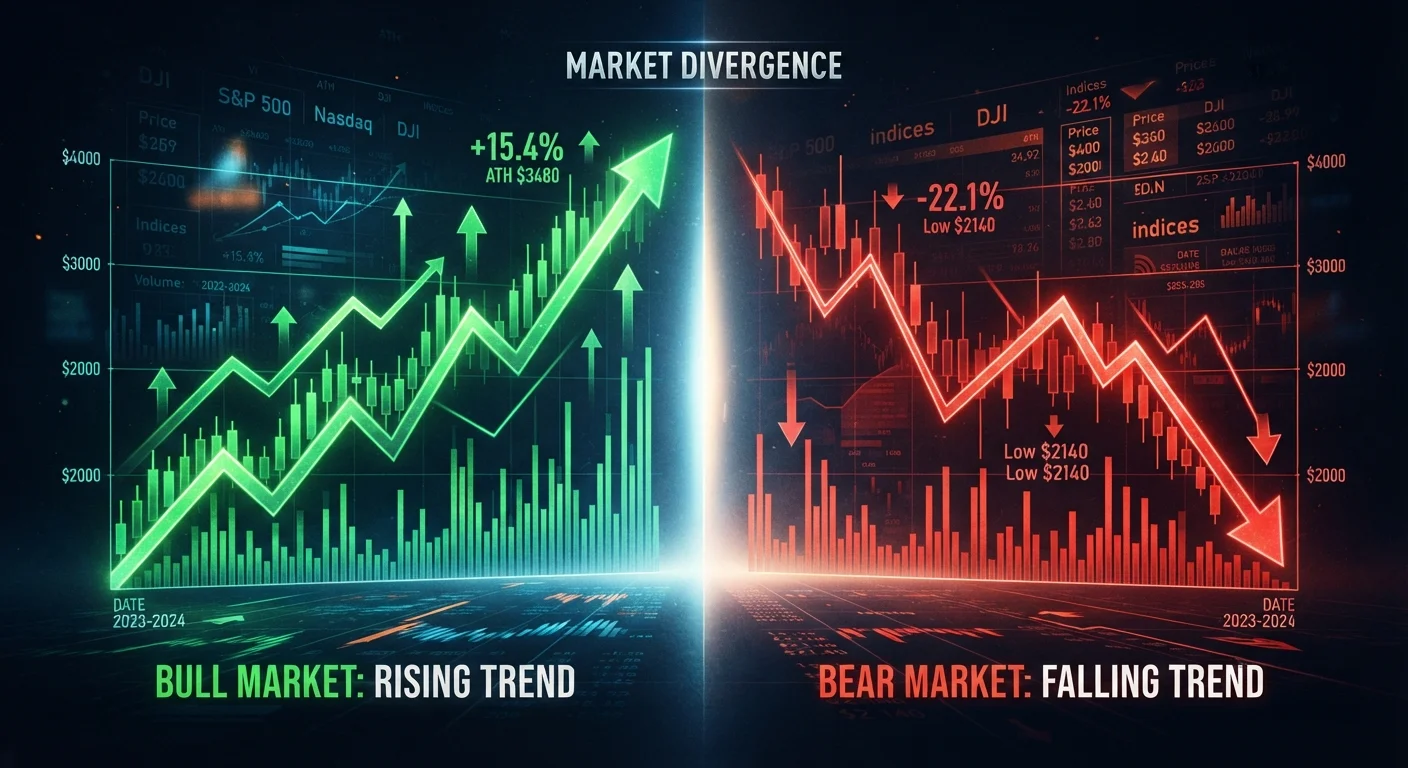
Bull Market
A sustained period of rising asset prices driven by confidence and growth.
Best for: Understanding when broad market gains have historically rewarded long-term, patient investors — though past performance never guarantees future results.
Option B
Bear Market
A prolonged decline in asset prices typically tied to economic stress or fear.
Best for: Recognizing the conditions that signal market contraction, which can prompt investors to reassess risk tolerance and consult a financial adviser.
Defining the Terms: It's About Magnitude and Duration
The terms bull market and bear market appear constantly in financial news — but they are often used loosely. In practice, both have broadly accepted definitions rooted in measurable thresholds, not daily swings.
A bull market is generally defined as a rise of 20% or more in a broad market index — such as the S&P 500 — from a recent low, sustained over a meaningful period. A bear market is the inverse: a decline of 20% or more from a recent peak, typically lasting at least two months. The 20% threshold is a widely used convention, though it is not a regulatory standard.
This distinction matters. A single bad week or a sharp two-day rally doesn't constitute either phase. Markets regularly fluctuate — a drop of 10% or less is typically called a pullback, while a decline between 10% and 20% is often labeled a correction. For a deeper look at how those terms compare, see how analysts define corrections and crashes.
| Criterion | Bull Market | Bear Market |
|---|---|---|
| Standard definition | ≥20% rise from recent low | ≥20% decline from recent high |
| Typical duration | Months to several years | Months to over a year |
| Primary drivers | Economic growth, low rates, confidence | Recession, rate hikes, shocks, fear |
| Investor sentiment | Optimistic, risk-tolerant | Cautious, risk-averse |
| Common asset flows | Into equities and growth assets | Into bonds, cash, defensive assets |
| Economic alignment | Often — but not always — with expansion | Often — but not always — with recession |
What Actually Drives Each Phase
Price movement is a symptom, not a cause. Both bull and bear markets are shaped by a web of economic, psychological, and structural forces.
Bull markets tend to coincide with periods of low unemployment, expanding corporate earnings, low or stable interest rates, and broad investor confidence. Positive economic signals can reinforce each other — rising employment supports consumer spending, which supports corporate revenue, which pushes equity prices higher. Sentiment plays a significant role: when investors expect conditions to improve, they often act in ways that accelerate price gains.
Bear markets can emerge from several sources. Recessions are one common driver, but not the only one. Rising interest rates, geopolitical shocks, financial crises, or sudden collapses in investor confidence can all trigger sustained declines. It's worth noting that stock market performance and overall economic health don't always align neatly — a point explored further in our piece on what the stock market actually measures.
~9.6 years
Average bull market duration (S&P 500, post-WWII)
According to Bespoke Investment Group analysis of S&P 500 data, bull markets have historically lasted nearly a decade on average, though individual cycles vary substantially.
~289 days
Average bear market duration (S&P 500, post-WWII)
Historical S&P 500 data shows bear markets have typically been shorter than bull markets in duration, though their effects on portfolios can be acute.
~36%
Average S&P 500 peak-to-trough decline in bear markets
Analysis of historical bear market cycles suggests average declines have ranged widely, with some exceeding 50% during severe downturns such as 2008–2009.
Macroeconomic conditions such as inflation also shape market direction. High inflation can erode corporate profit margins and prompt central bank rate hikes, which increase borrowing costs and dampen equity valuations. For a plain-language breakdown of those dynamics, see our coverage of inflation, deflation, and stagflation.
How Different Asset Classes Respond
Bull and bear markets don't affect all investments equally. Equities tend to be most directly tied to these cycles, but bonds, commodities, and other assets often behave differently — and sometimes inversely.
During bear markets, investors frequently shift toward assets perceived as lower risk: government bonds, cash, and defensive sectors like utilities or consumer staples. During bull markets, riskier assets — growth stocks, emerging market equities — often outperform. These patterns are not guaranteed, and they shift depending on the underlying cause of the cycle. For a more detailed look at how asset classes behave across economic conditions, see how bonds and equities respond differently across cycles.
Not All Bear Markets Lead to Recessions
A common misconception is that a bear market always signals an incoming recession. While the two often overlap, the relationship is not automatic. Markets are forward-looking mechanisms that price in expectations — meaning a sharp decline can reflect fears that never fully materialize. Similarly, recessions have occasionally begun without a preceding bear market in equities. Context and underlying causes matter as much as the price threshold itself.
This article provides general financial education only and is not personalized investment advice. Investors should consult a qualified, licensed financial adviser before making decisions based on their individual circumstances.
The content on this site is for informational purposes only and is not a substitute for professional advice. Always consult a qualified professional for guidance specific to your situation.